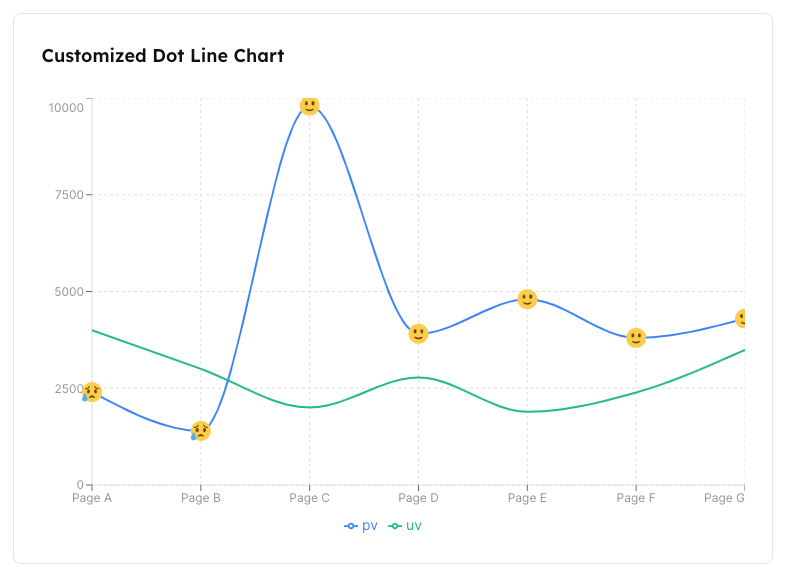
Custom Dot Line Chart
Custom Dot Line Chart
Preview
Code
apps/isomorphic/src/app/shared/chart-widgets/customized-dot-line-chart.tsx
'use client';

import {
  LineChart,
  Line,
  XAxis,
  YAxis,
  CartesianGrid,
  Tooltip,
  Legend,
  ResponsiveContainer,
} from 'recharts';
import { CustomTooltip } from '@/components/charts/custom-tooltip';

const CustomizedDot = (props: any) => {
  const { cx, cy, value } = props;
  if (value > 2500) {
    return (
      <svg
        x={cx - 10}
        y={cy - 10}
        xmlns="http://www.w3.org/2000/svg"
        width={20}
        height={20}
        viewBox="0 0 36 36"
      >
        <circle cx={18} cy={18} r={18} fill="#FFCC4D" />
        <path
          fill="#664500"
          d="M10.515 23.621C10.56 23.8 11.683 28 18 28c6.318 0 7.44-4.2 7.485-4.379a.499.499 0 0 0-.237-.554.505.505 0 0 0-.6.077C24.629 23.163 22.694 25 18 25s-6.63-1.837-6.648-1.855a.502.502 0 0 0-.598-.081.5.5 0 0 0-.239.557z"
        />
        <ellipse cx={12} cy={13.5} fill="#664500" rx={2.5} ry={3.5} />
        <ellipse cx={24} cy={13.5} fill="#664500" rx={2.5} ry={3.5} />
      </svg>
    );
  }
  return (
    <svg
      x={cx - 10}
      y={cy - 10}
      xmlns="http://www.w3.org/2000/svg"
      width={20}
      height={20}
      viewBox="0 0 36 36"
    >
      <path
        fill="#FFCC4D"
        d="M36 18c0 9.941-8.059 18-18 18-9.94 0-18-8.059-18-18C0 8.06 8.06 0 18 0c9.941 0 18 8.06 18 18"
      />
      <ellipse cx={11.5} cy={16.5} fill="#664500" rx={2.5} ry={3.5} />
      <ellipse cx={24.5} cy={16.5} fill="#664500" rx={2.5} ry={3.5} />
      <path
        fill="#664500"
        d="M23.485 27.879C23.474 27.835 22.34 23.5 18 23.5s-5.474 4.335-5.485 4.379a.496.496 0 0 0 .232.544.51.51 0 0 0 .596-.06c.009-.007 1.013-.863 4.657-.863 3.59 0 4.617.83 4.656.863a.496.496 0 0 0 .59.073.5.5 0 0 0 .239-.557z"
      />
      <path
        fill="#5DADEC"
        d="M10 30c0 2.762-2.238 5-5 5s-5-2.238-5-5 4-10 5-10 5 7.238 5 10z"
      />
      <path
        fill="#664500"
        d="M30 13c-5.554 0-7.802-4.367-7.895-4.553a1 1 0 0 1 1.787-.899C23.967 7.694 25.713 11 30 11a1 1 0 1 1 0 2zM6 13a1 1 0 0 1 0-2c5.083 0 5.996-3.12 6.033-3.253.145-.528.69-.848 1.219-.709.53.139.851.673.718 1.205C13.921 8.437 12.704 13 6 13z"
      />
    </svg>
  );
};

export default function CustomDotLineChart() {
  return (
    <ResponsiveContainer width="100%" height="100%">
      <LineChart
        data={data}
        margin={{
          left: -10,
        }}
      >
        <CartesianGrid strokeDasharray="3 3" />
        <XAxis dataKey="name" />
        <YAxis />
        <Tooltip content={<CustomTooltip />} />
        <Legend />
        <Line
          type="monotone"
          dataKey="pv"
          stroke="#3b82f6"
          activeDot={{ r: 8 }}
          strokeWidth={2}
          dot={<CustomizedDot />}
        />
        <Line
          type="monotone"
          strokeWidth={2}
          dataKey="uv"
          stroke="#10b981"
          dot={false}
        />
      </LineChart>
    </ResponsiveContainer>
  );
}